Anaerobic bacteria are prominent players in the gut and are responsible for the synthesis and transformation of diverse molecules involved in host-microbe and microbe-microbe interactions, which ultimately determine host phenotypes. Many of these microbes have specialized in specific metabolic conversions during evolution; the genes responsible for this ‘specialized primary metabolism’ are often physically clustered in the genome, in regions also known as metabolic gene clusters (MGCs).
gutSMASH is a tool that has been developed to fulfill the need for systematically evaluating the metabolic potential of these bacteria by predicting both known and novel anaerobic MGCs from the gut microbiome. Moreover, gutSMASH also predicts MGCs that allow bacteria to acquire energy from different sources.
Altogether, this new software provides a comprehensive toolkit to functionally characterize anaerobic bacterial genomes by not only predicting MGCs with known functions but also novel MGCs that may represent good candidates for further experimental characterization.
The ideal input for gutSMASH is an annotated nucleotide file in Genbank format or EMBL format. You can either upload a GenBank/EMBL file manually, or simply enter the GenBank assembly accession of your genome for gutSMASH to download it. Alternatively, you can provide a FASTA file containing one or more sequences. If possible, you should also supply a separate GFF3-formatted file containing the annotation information for all said sequences. Otherwise, gutSMASH will generate a preliminary annotation using Prodigal, and use that to run the rest of the analysis.
Input files should be properly formatted. If you are creating your GBK/EMBL/FASTA file manually, be sure to do so in a plain text editor like Notepad or Emacs, and saving your files as "All files (*.*)", ending with the correct extension (for example ".fasta", ".fna", ".fa", ".gb", ".gbff", ".gbk", or ".embl").
There are several optional analyses that may or may not be run on the sequence. Highly recommended is the KnownClusterBlast Comparative Analysis, that compares the amino acid sequences of proteins encoded within a predicted MGC to a manually curated set of MGCs of known function using Diamond. In this way, the user can check if there are any homologues with known functions associated to the predicted MGC.
The output of the gutSMASH analysis pipeline is organized in an interactive HTML page with SVG graphics, and different parts of the analysis are displayed in different panels for every gene cluster.

Initially, a list of identified clusters is displayed in the results page.
A gene cluster can be selected for viewing by clicking its number (gene clusters are numbered in the order in which they appear on the input nucleotide sequence) in the "Overview" panel just below the top banner or by clicking on the "Region XX" boxes.
A click on "Overview" brings you back to the overview list.
Gene cluster buttons are color-coded based on the type of molecule each MGC synthesizes. Also, there's a category for hybrid gene clusters, energy-capturing-related MGCs and putative MGCs.

In the upper panel, "Gene cluster description", information is given about each predicted MGC. In the upper line, the length and location of the gene cluster are displayed. Underneath this title line, all genes present in the predicted MGC are outlined.
Genes are color-coded based on their function in the pathway; e.g. core genes, transport-related or regulatory, whenever Annotation of functional gene categories is enabled.
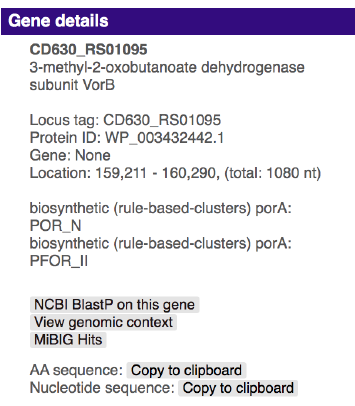
Hovering over a gene with the mouse will prompt the gene name to be displayed above the gene. Clicking the gene will provide more information on the gene: its annotation, its sequence similarity with other genes in the cluster, its location, and cross-links specific to that gene.

If you enabled Gene Cluster Comparative Analysis (ClusterBlast), this panel will display the top ten most similar MGCs from a pre-computed gutSMASH run on three different bacterial reference collection.
The drop-down selection menu can be used to browse through the gene clusters.
Genes with the same colour are putative homologs based on significant Blast (Diamond) hits between them.

In the upper right, a small list of buttons offers further functionality. The house-shaped button will get you back to the gutSMASH start page. The question-mark button will get you to this help page. The exclamation-mark button leads to a page explaining about gutSMASH. The downward-pointing arrow will open a menu offering to download the complete set of results from the gutSMASH run. The EMBL/GenBank file can be viewed in a genome browser such as Artemis.

For more information on the MGC types and classes predicted by gutSMASH you can also check our documentation page
gutSMASH uses detection rules, that are Pfam (domain) combinations defining of a specific pathway. These detection rules have been built semi-manually, based on a collection of gene clusters previously characterized. Their performance was validated by running gutSMASH on the HMP2 dataset. The predicted gene clusters were then subjected to a detailed visual inspection and literature analysis.
A set of known pathways was used as input for an iterative homology search approach. The resulting MGC collection was screened and helped to design the general detection rules. The original Genbank files of this subset of pathways can be downloaded from here: subset_known_pathways.zip